
![[academic] [image] Its the car. Always.](https://lemmy.world/pictrs/image/023db330-cb18-4619-8436-1aadbce5eff9.png)
Whenever media, politicians, people or even the police complain about dangerous cyclists, with their reckless driving, without a helmet, without a light, please remember it is a distraction. They don’t want you to know the truth, because they love their cars more than the neighbors children.
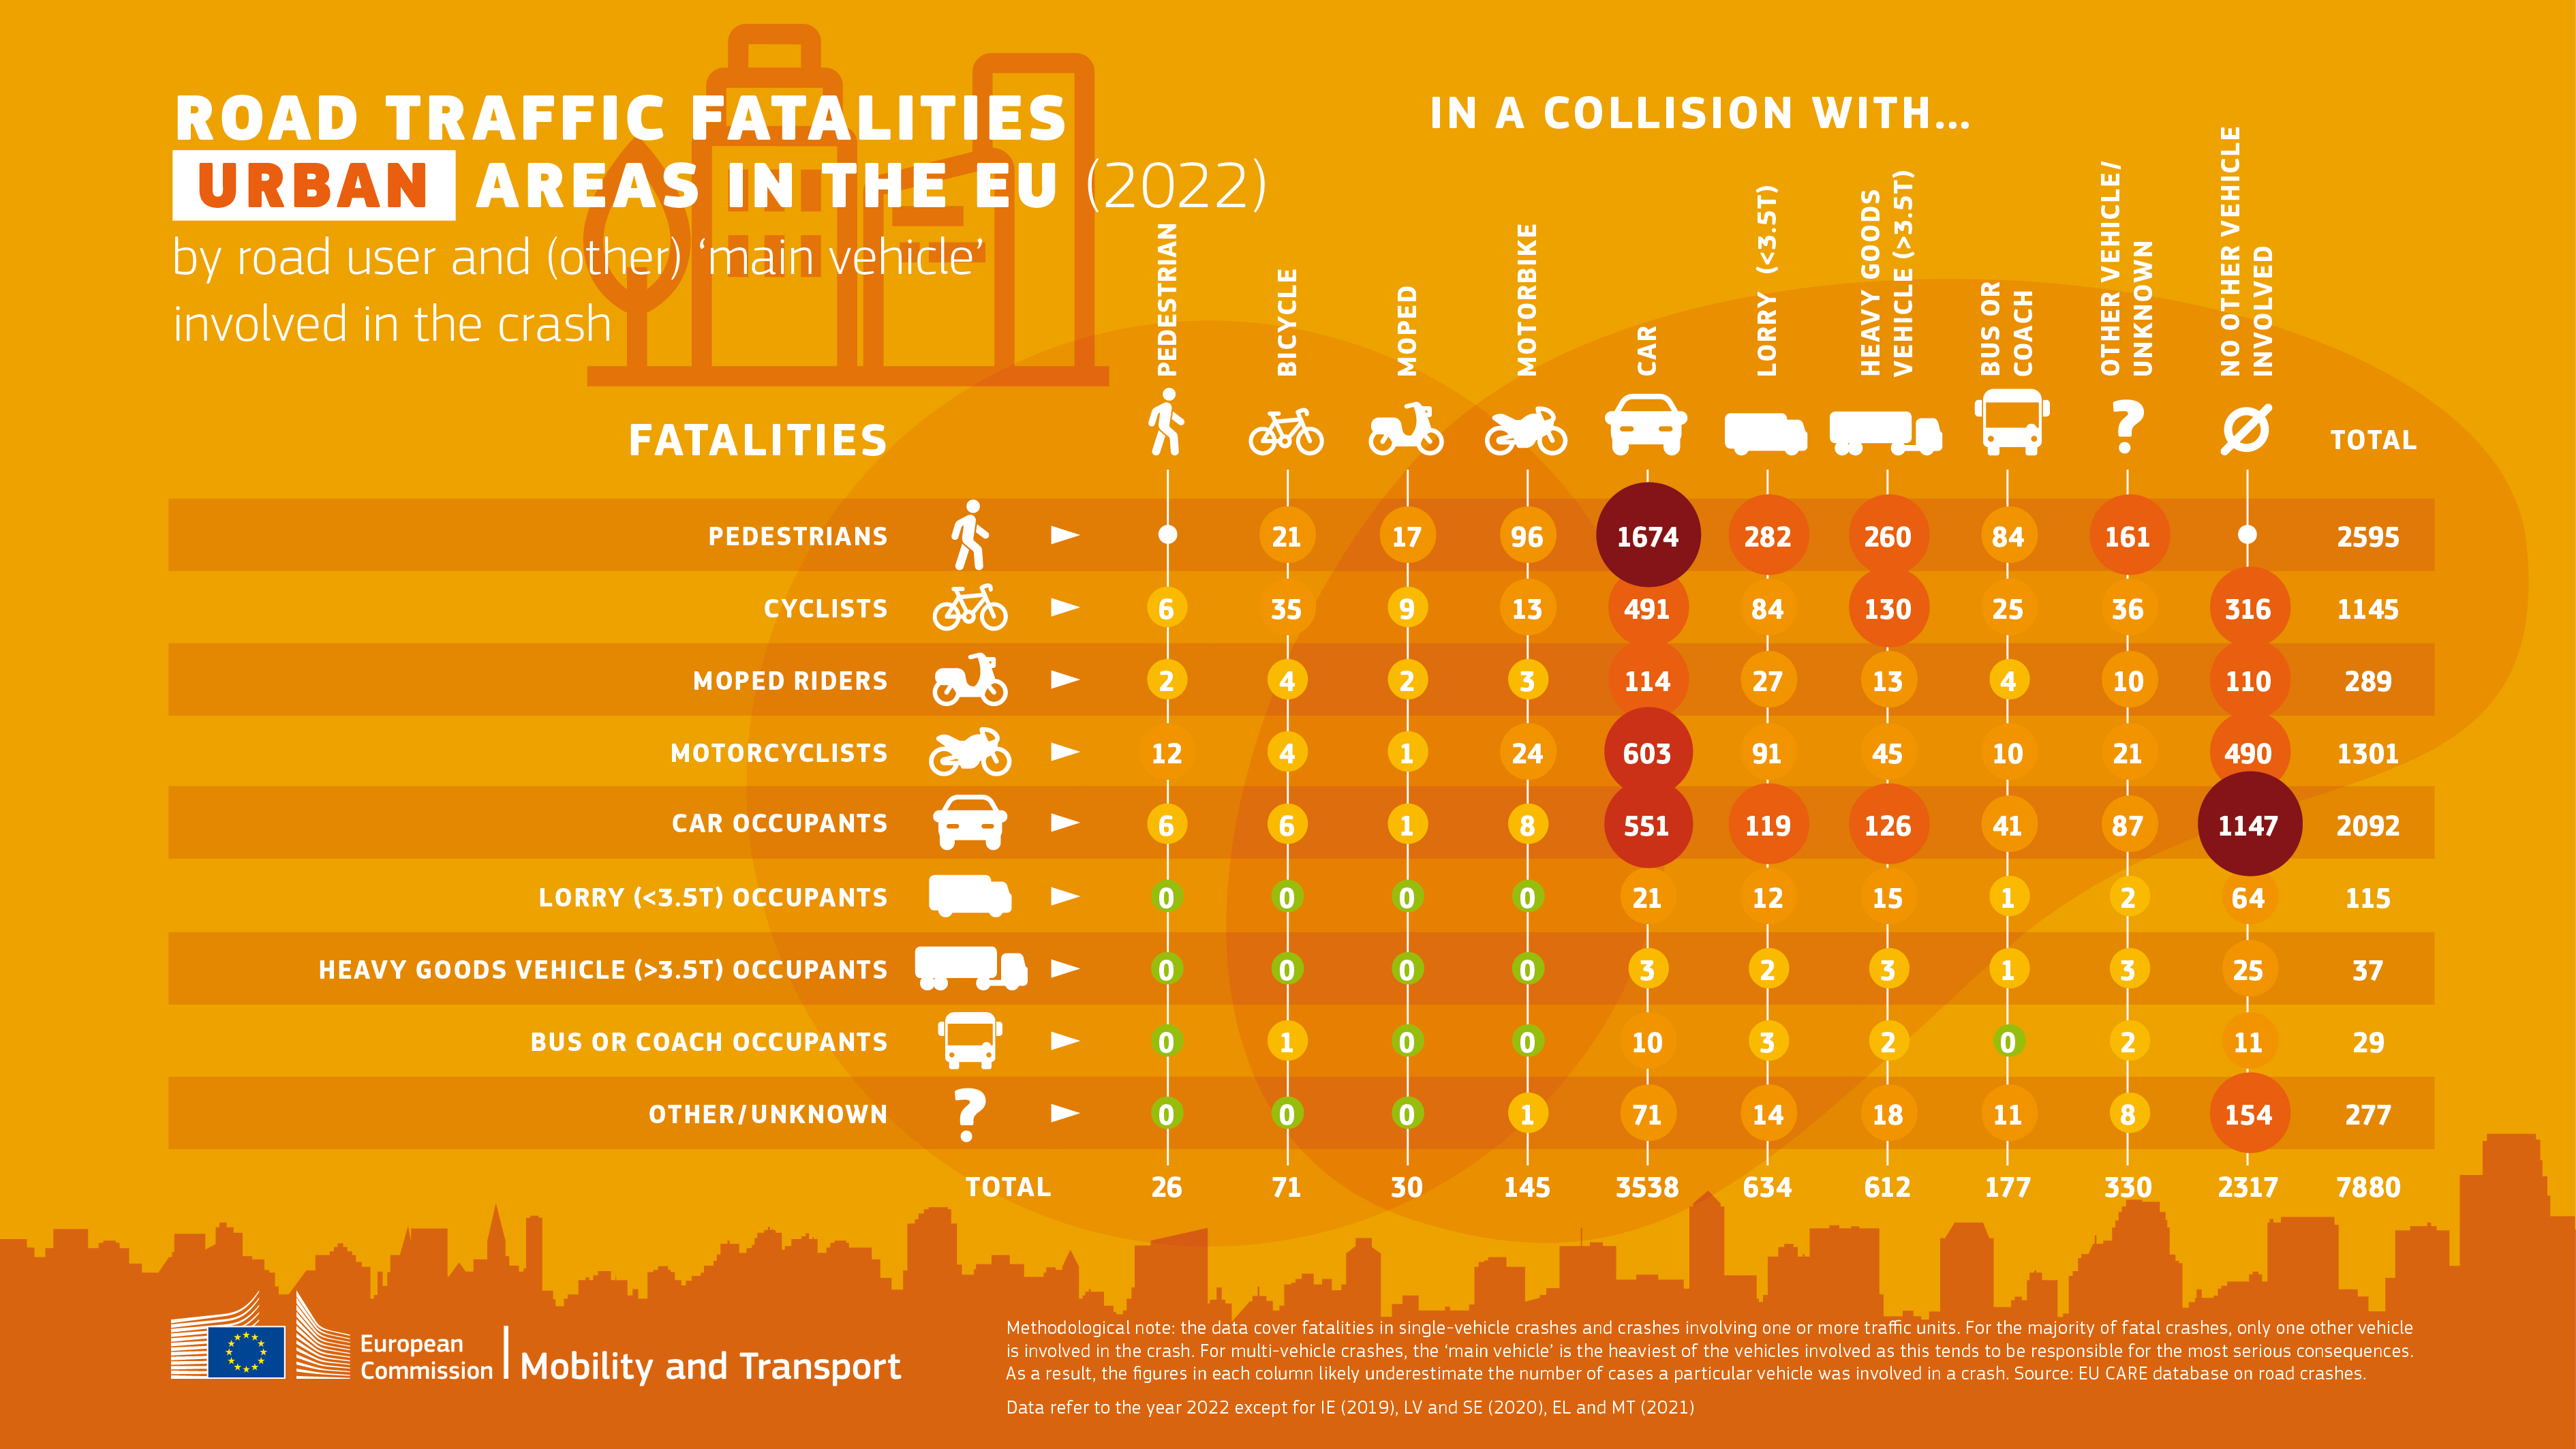
I kindly ask you to remind them of this table whenever the topic comes up. For example: ‘yes, cyclists should have a light to reduce danger, but remember that the car is the bigger danger by far. Always. And whenever we ignore that, we accept the loss of lives.’ This is not whataboutism, because regarding safety, the numbers clearly show which culprit to urgently address first.
Even if the car was more dangerous in the past and safety regulations have helped: these numbers are from 2022. If you feel safer driving in a car, instead of walking or cycling: look for the deaths for car-on-car collisions.
There is no way around this: if we have that many cars driving fast, we will have that many deaths.
Thank you!
Sources:
similar matrix but for cities only
[academic] [image]
I’m here to ask the grand question yet again:
Is that the raw deaths per vehicle, or does it equalize relative vehicle popularity?
I assume that there are a fair bit more cars on the roads than there are motorbikes, which means that we would not be able to compare them otherwise. Unless, of course, if one simply is trying to sow discord.
There is a URL to the study. Let us know what you find.
I think i saw somewhere that motorbikes are more deadly relatively, but mostly to their own rider.
Do you mean me? Because i don’t have numbers on motorbikes?
Yes, I did indeed read the study - even before I posted my rhetorical question - which appears to be the raw numbers.
And are you trying to tell me, that you do not have the raw numbers of motorbike-related accidents in relation to car-related accidents according to the European Commission for 2022? I find that hard to believe.
EDIT: My bad, you meant the numbers of vehicles needed to equalize the raw numbers. Plus, the graph appears to already take relative popularity into account with the reversed relations.
But that doesn’t fit the narrative